
Large multinationals are moving from pledges to procurement and projects — locking in long-dated clean power contracts, electrifying heat and fleets, re-tooling supply chains, and backing carbon removal. More broadly, the global energy transition to renewable technologies remains intact, but uneven. Global energy investment will reach $3.3 trillion USD in 2025, with $2.2 trillion being invested in renewables, nuclear, grids, storage, low-emissions fuels, efficiency, and electrification (which stands at 2x fossil investment). On a dual-track energy system — adding clean energy capacity without fully displacing fossil fuels — China, the EU, India, and the U.S. continue to drive most of the additions.
Key takeaways:
- Corporate momentum for the energy transition remains strong; ~60% of the S&P 500 have announced net-zero or carbon-neutral commitments, with ~85% still moving forward and funding broader Sustainability work
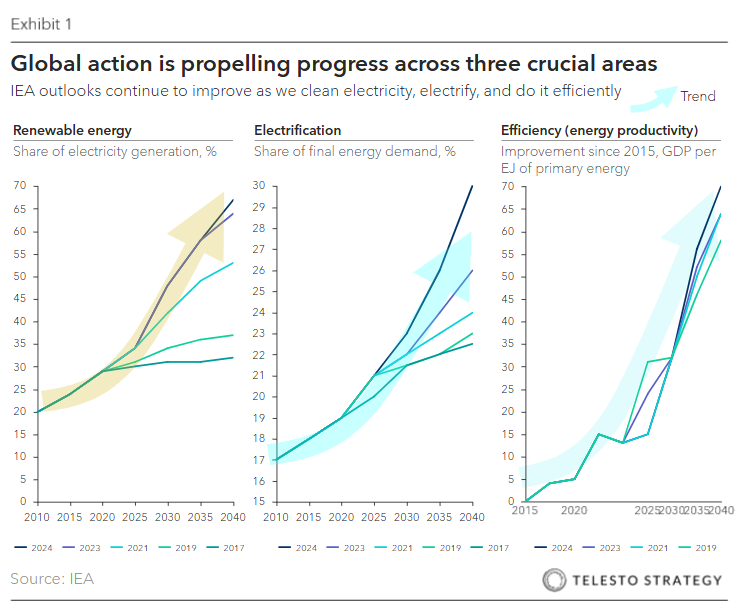
- The renewable energy transition continues to progress globally, even if uneven and on a dual-track with fossil fuel expansion
- The primary bottlenecks to the energy transition remain infrastructure and policy friction — from shifting tariffs to local content rules and action redesigns. The policy volatility is reshaping capital flows across regions.
- Electrification of transport, industry, and buildings continues to rise, with global electricity demand expected to grow to 3.7% in 2026.
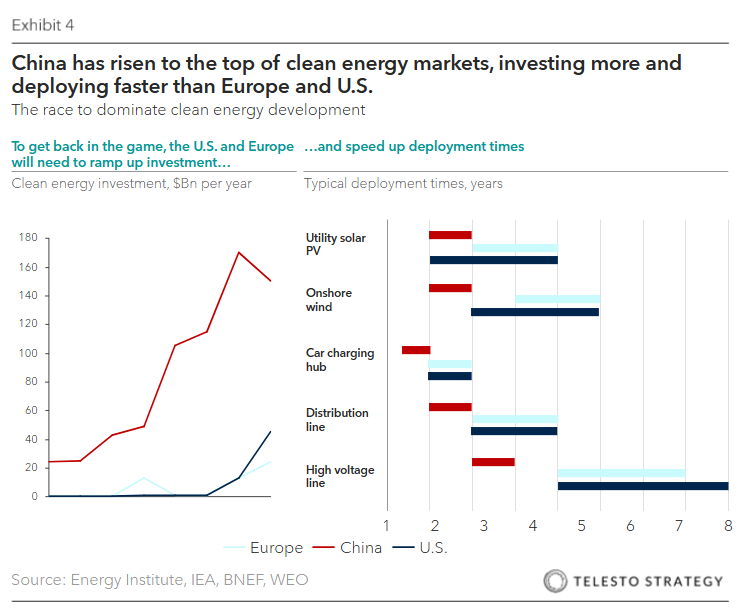
- China has cemented its leadership role across energy generation, storage, and electrification
The global energy transition is no longer a linear shift from fossil fuels to renewables — it is a multi-speed, policy-charged, capital-intensive reconfiguration of the world’s energy and industrial systems. For corporate boards, the conversation has moved well beyond ESG reporting and long-dated targets. The core strategy questions now concern cost of capital, infrastructure reliability, geopolitical exposure, regulatory shift, increase costs of energy, and the focus on energy security (e.g., resilience, reshoring, and supply chain control).
Key figures and trends:
- Increased investment. Even amidst economic uncertainty, Global energy investment is projected to hit a record $3.3 trillion in 2025, with clean technologies accounting for over two-thirds of the total.
- China leads. China has cemented its position as the world’s single largest investor in energy and clean energy supply chains, having outspent the U.S. and Europe 10-fold in the past five years.
- Preference for renewables. Renewable energy is outcompeting fossil fuels for investment in the power sector, with solar and wind expected to meeting nearly three-quarters of global electricity demand growth.
- Cost falling fast. Solar module prices fell 35% to 9 cents per watt; EV batteries are now below $100/kWh and often at cost parity with fossil-fueled competition.
- Record-high energy demand. 2024 saw strong electricity demand growth, up 4.3%, driven by heatwaves and data center expansion.
- Investment gap. While clean energy investment reached $2 trillion in 2024, it remains short of the annual target of $5.6 trillion for emissions reductions in line with the Paris Agreement.
- Trade uncertainty. The fast-evolving economic and trade picture means that some investors are adopting a wait-and-see approach to new energy project approvals, but in most areas we have yet to see significant implications for existing projects.
- Need for infrastructure. Achieving net-zero goals requires resilient grids and targeted capital flows, especially in emerging markets.
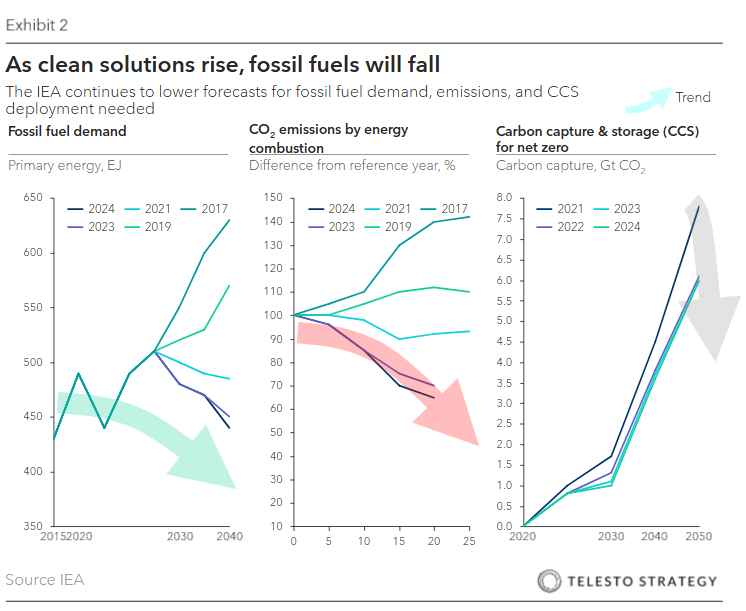
- Oil and coal face decline, though speed is uncertain. Oil demand in Bloomberg’s New Energy Outlook report’s base-case ‘Economic Transition Scenario’ peaks in 2032 at 104 million barrels per day, with road fuel peaking a few years earlier. Demand ultimately drops to 88 million barrels per day by 2050 – a significant decline from today, but far from the drop required to get on track for net zero.
- Critical minerals. Lithium, copper, nickel, rare earths, and graphite have become the new enablers of industrial and clean energy competitiveness. Chine control of processing still exceeds 60-80% across key minerals. Policy interventions will influence cost, sourcing risk, and compliance exposure.
Global progress mixed as COP30 approaches
Is the world making progress to meet its 2030 targets, as set out in the Paris Agreement? Overall, the world is not on track to achieve the emissions reduction goals, though progress varies significantly by region. The United Nations Environment Programme’s (UNEP) 2024 Emissions Gap Report is the most authoritative assessment of global progress. Its key findings include:
- Insufficient pledges. Current commitments are not enough; global mobilization on an unprecedented scale is required to meet Paris Agreement targets.
- Potential for reduction. Significant opportunities exist to reduce emissions through 2030 and 2035 by focusing on renewable energy, efficiency, and electrification across sectors like buildings, transport, and industry.
- Fossil fuel reliance. Governments plan to produce more than double the amount of fossil fuels consistent with a 1.5°C pathway, a “production gap” that has widened since COP28.
As we look to COP30 in Brazil in the coming weeks, expect to see continued debate and dimensionality to national climate plans, a retained focus on phasing down fossil fuels, quadrupling of renewable energy, and a push for greater accountability in financing renewable energy projects, especially in developing nations.
The focus will be on implementing existing agreements, setting ambitious 2035 emission reduction targets, and establishing financial roadmaps for a $1.3 trillion climate finance goal.
Energy economics and the cost shifts for renewable technologies
In recent years, energy economics of renewable technologies has been fundamentally transformed by rapid cost reductions and technological breakthroughs, especially for wind and solar. The shift is primarily driven by economies of scale in manufacturing and efficiency gains. More recently, the declining costs are less straight forward with raising interest rates and inflation. The result is more nuanced market landscape where cost competitiveness must be viewed in the context of these financial pressures.
Looking to 2026, the market will contend with several key dynamics. Supply chain issues, including sourcing challenges related to domestic content rules and general logistics, are expected to continue. For solar, an average installation decline from 2025 to 2027 is projected due to policy uncertainty and rising costs from tariffs, though a recovery is expected later in the decade as the domestic supply chain matures. In wind, U.S. manufacturing capacity for components like blades and towers continues to lag behind projected deployment levels, indicating potential bottlenecks.
However, demand for electricity is forecast to grow robustly in the U.S., driven by the expansion of data centers and clean energy manufacturing, creating strong market pull.
EIA publishes its first energy-sector forecasts through 2026
The U.S. Energy Information Administration (EIA) published its first forecasts for energy production, consumption, and prices through 2026 in its Jan Short-Term Energy Outlook (STEO).
| U.S. energy market indicators | 2024 | 2025 | 2026 |
|---|---|---|---|
| Brent crude oil spot price (dollars per barrel) | $81 | $74 | $66 |
| Retail gasoline price (dollars per gallon) | $3.30 | $3.20 | $3.00 |
| U.S. crude oil production (million barrels per day) | 13.2 | 13.5 | 13.6 |
| Natural gas price at Henry Hub (dollars per million British thermal units) | $2.20 | $3.10 | $4.00 |
| U.S. liquefied natural gas gross exports (billion cubic feet per day) | 12 | 14 | 16 |
| Shares of U.S. electricity generation | |||
| Natural gas | 43% | 41% | 40% |
| Coal | 16% | 15% | 15% |
| Renewables | 23% | 25% | 27% |
| Nuclear | 19% | 19% | 19% |
| U.S. CO2 emissions (billion metric tons) | 4.8 | 4.8 | 4.8 |
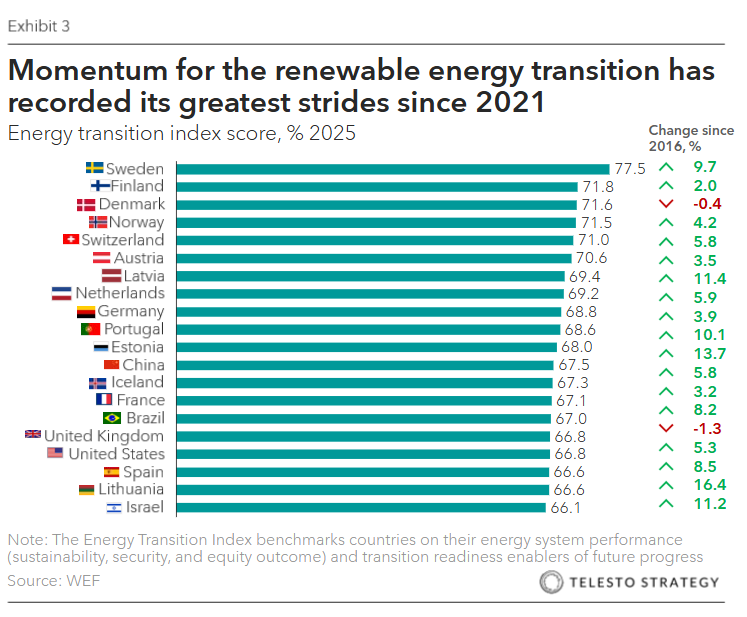
Momentum for the renewable energy transition has recorded its greatest strides since 2021, which coincided with the beginning of the energy crisis.
The 2025 Energy Transition Index (ETI) recorded a 1.1% year-on-year increase in global scores – over twice the average pace of the past three years. The ETI framework evaluates 118 countries across three system performance dimensions—security, equity, and sustainability—and five enabling dimensions that reflect transition readiness.
| Country | 2025 ETI score | Structural strengths | Progress highlights 2025 |
|---|---|---|---|
| Sweden | 77.5 | Clean energy mix (biofuels, nuclear, waste), strong regulation, market-based policies and top-tier innovation ecosystem | Continued to lead the ETI, driven by rising low-carbon technology advantage, effective carbon pricing through net carbon rates, low methane emissions, clean job growth, robust R&D investment and a top-ranked credit rating |
| Finland | 71.8 | Legally binding 2035 carbon neutrality target, sector-specific decarbonization plans and strong nuclear/renewables energy mix | Advanced with reduced fuel imports and led in grid reliability, low transmission losses and minimal power interruptions |
| Denmark | 71.6 | Net zero by 2045, backed by a comprehensive policy framework, diversified energy mix, offshore wind leadership and hydrogen infrastructure expansion | Led in economic freedom, supported by open markets, transparent regulation and strong institutional frameworks |
| Norway | 71.5 | Clean power mix (hydro, wind), robust, interconnected grid, high transport electrification and capital access via sovereign wealth fund | Strengthened position with soaring clean energy investment and world’s lowest net energy imports, reflecting strong export capacity |
| Switzerland | 71.0 | Advanced regulatory architecture (CO2 Act), clean, balanced energy mix, and innovation hubs | Maintained performance with rising renewables and clean job creation, underpinned by world-leading carbon pricing |
| Austria | 70.6 | Strong public support for early climate neutrality (2040) and accelerating renewable deployment through integrated national energy and climate planning | Climbed rankings with more clean energy jobs and led infrastructure with robust renewable capacity buildout |
| Latvia | 69.4 | Expanding renewable share, modernization of grid and cross-border interconnection of grids with Continental European Network | Top improver with soaring clean investment (+973% y-o-y), strengthened grid and leading low-carbon job share |
| Netherlands | 69.2 | Strong transmission infrastructure and substantial investments in (smart) grid modernization and hydrogen-ready networks | Strengthened performance with a rise in clean energy investment and declining reliance on gas imports |
| Germany | 68.8 | Sectoral net-zero targets, strong support frameworks for hard-to-abate sectors, and dedicated hydrogen infrastructure investment | Maintained energy transition progress through expanded renewable capacity and ongoing coal phase-down and growing clean energy employment |
| Portugal | 68.6 | Expanding renewable share (wind) and major investments in grid, hydrogen and offshore wind development | Improved performance with a cut in net fuel imports and greater affordability for industry |
That being said, energy security has made more limited progress, and transition readiness momentum has slowed. Moreover, global energy systems are facing increasing pressure from climate change, geopolitical, economic and technological disruptions.
China’s renewable leadership
The U.S.’s pullback on environmental priorities has created a leadership vacuum that has enabled Beijing to slow its progress on GHG reductions. Both the lack of competition with the U.S. and internal economic pressures have contributed to China’s realignment on climate priorities.
Still, China’s attempt to achieve its stated carbon-neutrality pledge will not be straightforward. Independent analysts have estimated the total investment required to be between $5 to $15 trillion over the next 30 years. In addition to the massive investment, China will have to restructure its economy to lessen its dependence on coal power—specifically, coal power will have to be phased out by 2040 to fulfill Xi’s carbon-neutrality pledge.
For the Chinese government, renewable technology investments make sense for the national economy and the planet. With China’s overall economy slowing down, the country’s climate and energy sector is a bright spot, one that’s fueling economic growth. Clean energy contributed a record 11.4 trillion yuan ($1.6 trillion) to China’s economy in 2023, as the single largest driver of growth
Implications and risks for corporate directors:
- Heightened regulatory risk. The growing “gap between rhetoric and reality” will intensify political pressure for stricter climate policies. Companies may face increased regulation, carbon taxes, or mandatory reporting requirements.
- Physical climate risk. The potential for extreme warming and climate shocks, as highlighted by the UNEP report, means companies must prepare for more frequent and severe climate-related events, such as supply chain disruptions, damage to physical assets and infrastructure, and increased operational costs
- Reputation and brand risk. As the climate crisis intensifies, public and investor scrutiny of corporate climate pledges will increase. Failure to align with global climate goals may damage a company’s reputation and lead to shareholder activism.
- Wait and see approach. The fast-evolving economic and trade picture means that some investors are adopting a wait-and-see approach to new energy project approvals, but in most areas, we have yet to see significant implications for existing projects.
Key variables directors should track:
- OPEC+ policy discipline and timing of any cuts if prices undershoot in early 2026
- Russian supply risks (sanctions, refinery and pipeline disruptions)
- Middle East maritime security in the Red Sea and Suez Canals
- Extreme weather events
- Climate and environmental policies
- Energy efficiency investments
- Natural gas project ramp-up and reliability in the U.S. Gulf, Qatar, Canada and the transition from coal to gas in Asia
- European and U.S. storage trajectories
- Refining system capacity and outages
- Data center and AI power demand, which is shaping North American electricity trajectories
- Macro and trade policy, which cap oil demand
- Global carbon policy, emissions pricing, and credit trading
Questions for the boardroom:
- How is the energy transition reshaping the company’s core cost structure and long-term profitability?
- Do we have a point of view on where our sector’s energy mix will be in 3, 5, and 10 years?
- Which transition critical inputs (e.g., copper, batteries, grid capacity) pose the greatest risk to operations or margins?
- Are we overly concentrated in regions vulnerable to trade restrictions, political reversals, or grid inadequacy?
- Have we run scenarios for high-carbon pricing, sudden subsidy changes, or energy supply disruption?
- Are we engaging in offtake agreements, joint ventures, or tech pilots that lock in cost and supply advantages?
- Which committee owns board-level oversight of energy transition risk and investment?
- Do our disclosures, transition plans, and investor messaging align with our actual execution strategy?
Additional Telesto resources:
- Parallax helps organizations project future Scope 2 emissions to right-size clean energy investments, conserve financial resources, and meet emissions reduction targets.
- Odyssey is a fully customizable, AI- and Machine Learning-driven platform which allows your organization to generate operating cost savings and improve capex planning in your sustainability journey.
- Prism, our ESG benchmarking tool, helps your organization to rapidly strengthen its Sustainability, Climate, and ESG performance and disclosures through in-depth benchmarking of industry peers and identification of gaps and areas of distinction